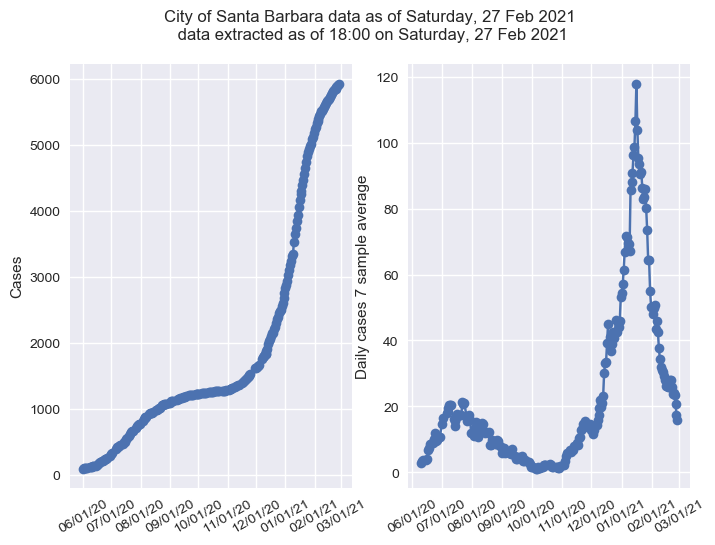
I can’t help being a little obsessive about the coronavirus situation in our little town of Santa Barbara. One can find a lot of data at the county level in the California state web sites, but broken down by city I could find it only in the County web page and not in a form that was quite what I wanted. So I wrote a little python script that extracts the data from the county web page, and creates plots of the total cases in the City of Santa Barbara, as well as a 7-day average of new cases reported (it is an average over the last 7 days of reports, not over a fixed week range, but that is because the county does not report every day).
The original data is here: https://publichealthsbc.org/status-reports/
I’ve automated this so that the plots automatically update daily. Be aware that this is just an amateur project, and there could be errors, for example if the County changes its format for displaying the data. This was a little bit of a fun project to do. I wrote a python script to extract the data from the county page and create the plots. Then a shell script uses git to upload the plot to github, and the web page has an embedded image link to the plot in the github repository. The shell script runs daily on my mac laptop using launchd. All the code (except the launchd xml file) is on github here: https://github.com/balents/covidSB .

Very interesting and informative